steel-building-structural-health-monitoring
Steel Building Structural Health Monitoring: Sensors & Damage Detection

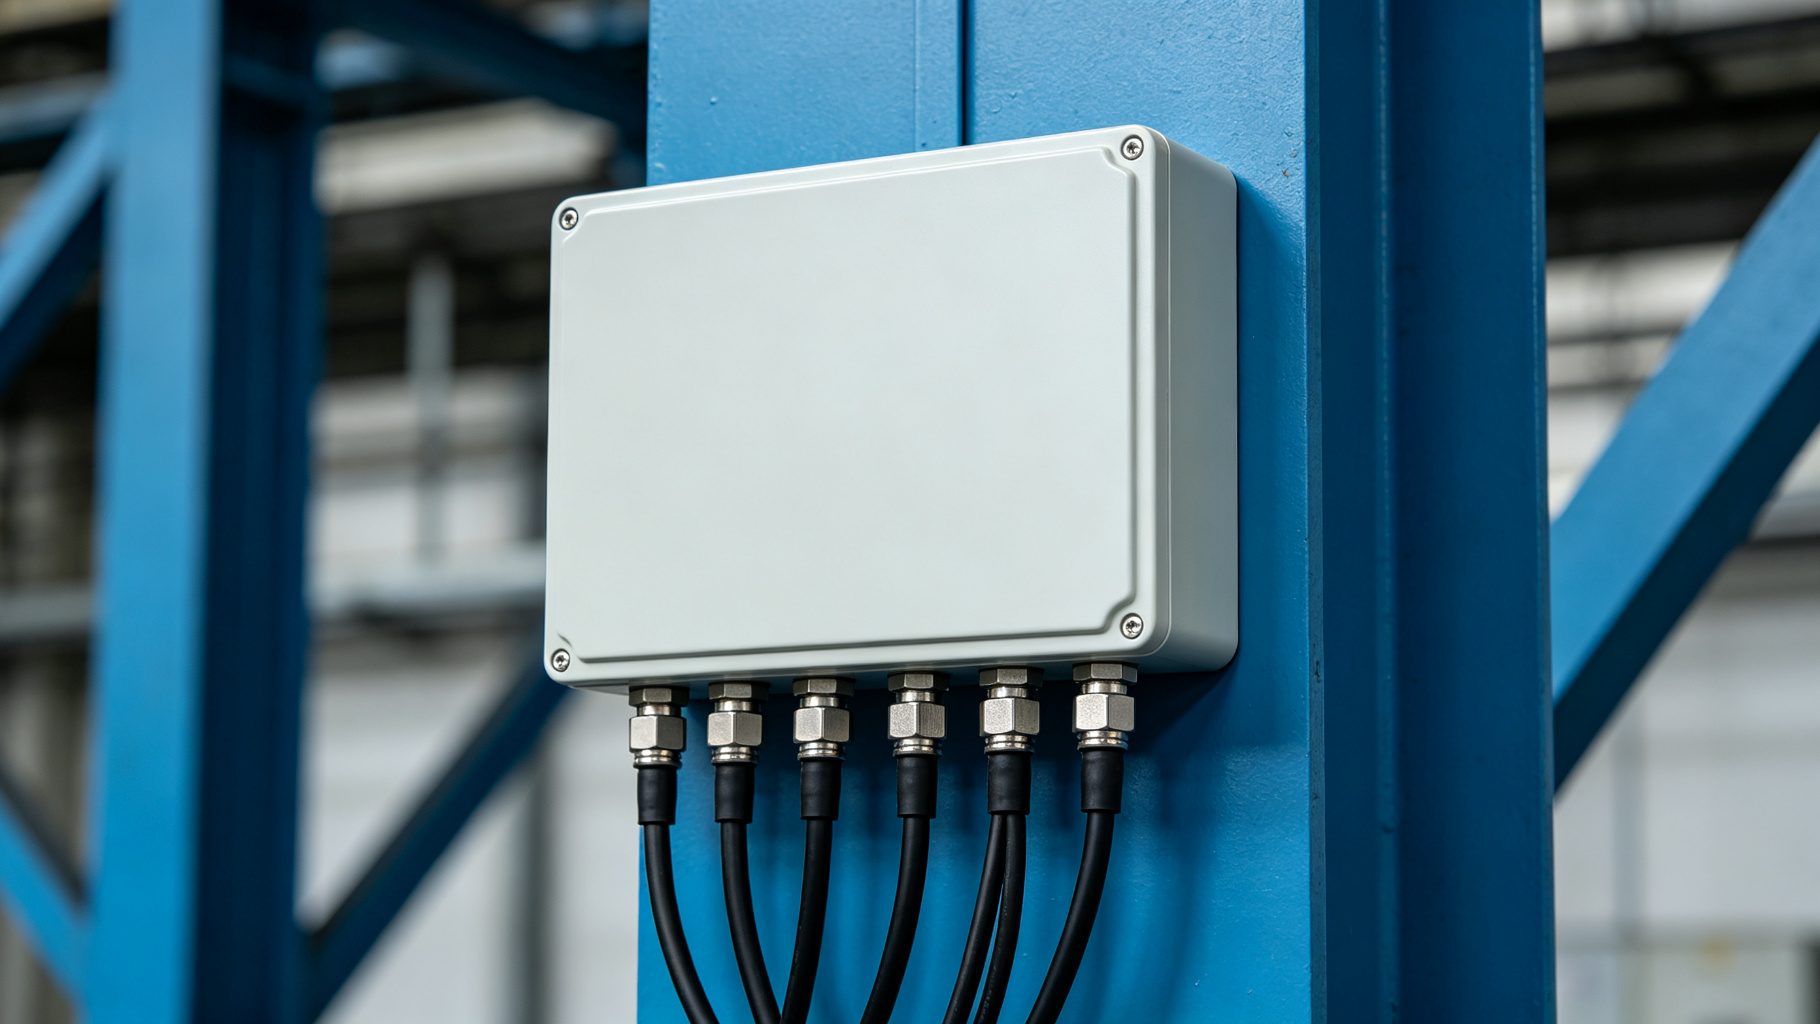
Close-up of strain gauge sensors bonded to a steel beam flange, with wiring running to a data acquisition box inside an industrial facility.
A temperature sensor tells you the building is 28°C (82°F). A strain gauge tells you the column is carrying 12% more load than it did last year—and that a connection may be loosening. That is the difference between building automation and steel building structural health monitoring (SHM). SHM uses strain gauges, accelerometers, and displacement sensors to track structural response over time, detect damage before it becomes visible, and trigger inspection when thresholds are exceeded. This guide covers sensor selection, modal analysis, damage detection algorithms, alarm thresholds, and cost. Our IoT monitoring article covers environmental sensors, energy dashboards, and equipment telemetry. SHM is different: it measures the steel itself—stress, vibration, and deflection—and uses changes in modal properties to find hidden damage.
What Is SHM—and Why Steel Needs It
General IoT monitoring answers one question: is the building comfortable? It tracks temperature, humidity, energy consumption, and equipment runtime. SHM answers a different question: is the steel safe? It measures strain, acceleration, displacement, and crack propagation at sampling rates 50–500 times faster than environmental sensors.
Steel structures benefit from SHM in four specific scenarios:
- Crane girders under repeated loading. Overhead cranes cycle thousands of times per year; fatigue cracks initiate at weld details and propagate before visual inspection catches them.
- Long-span roofs. A 30 m (100 ft) or wider truss or girders deflect under live load; SHM tracks whether deflection is increasing over time.
- Seismic retrofits. After an earthquake, SHM provides immediate vibration data to prioritize inspection.
- Historic or landmark steel structures. Where the remaining service life is uncertain, continuous monitoring informs maintenance decisions.
A complete SHM system has four layers. The sensor layer includes strain gauges, accelerometers, displacement transducers, and temperature-compensation sensors. The data acquisition layer samples at 100–1,000 Hz over wired Ethernet or wireless LoRa/5G. The analysis layer performs modal identification, baseline comparison, and damage index calculation. The presentation layer delivers dashboards, alarms, and periodic reports to facility managers.
For the broader IoT monitoring ecosystem, see steel structure IoT monitoring. For how SHM data feeds a digital twin model, read steel building digital twin. Per the ISO 16589 framework, SHM systems should document sensor placement, sampling rates, and alarm thresholds as part of a structured monitoring plan.
Sensor Selection: Strain Gauges and Accelerometers
Steel building structural health monitoring begins with sensor selection. Two sensor types dominate: strain gauges and accelerometers.
Strain gauges measure micro-deformation in the steel surface, which converts directly to stress using the material's modulus of elasticity. Resistance foil gauges offer precision of ±1–5 microstrain and are bonded to weld toes, bolted connections, and beam mid-spans. Fiber Bragg Grating (FBG) gauges resist electromagnetic interference and transmit over long distances, making them suitable for large-span structures. Typical installation locations include column bases, beam ends, crane girder bottom flanges, and bracing connection nodes. Static monitoring samples at 1–10 Hz; dynamic monitoring (fatigue, wind response) samples at 50–500 Hz.
Accelerometers measure vibration acceleration. MEMS accelerometers are low-cost and adequate for general building vibration monitoring. Piezoelectric accelerometers offer higher frequency response (1–500 Hz) and sensitivity, making them the standard for modal testing. A minimum of two accelerometers per floor per axis forms a mode-shape measurement array.
Table 1 summarizes the primary sensor types and specifications. For vibration design context, see steel structure vibration control. For deflection limits that strain gauges help enforce, read steel structure deflection control.
Table 1: SHM Sensor Types and Specifications
| Sensor Type | Measured Quantity | Accuracy | Sampling Rate | Typical Locations |
|---|---|---|---|---|
| Resistance foil strain gauge | Surface strain (microstrain) | ±1–5 με | 1–500 Hz | Column bases, beam ends, girder flanges |
| Fiber Bragg Grating (FBG) strain | Strain (με) | ±2 με | 100–1,000 Hz | Long-span trusses, EM-noise environments |
| MEMS accelerometer | Acceleration (m/s², g) | ±0.005 g | 10–200 Hz | Floor vibration, general monitoring |
| Piezoelectric accelerometer | Acceleration (m/s², g) | ±0.001 g | 1–500 Hz | Modal testing, high-frequency fatigue |
| Displacement transducer | Relative displacement (mm/in) | ±0.01 mm (±0.0004 in) | 1–10 Hz | Mid-span deflection, support settlement |
Sampling rates depend on whether the application is static (creep, settlement) or dynamic (wind, seismic, fatigue). Over-sampling wastes data storage; under-sampling misses critical events.
Modal Analysis and Baseline Model Updating
Every steel structure has natural vibration frequencies determined by its stiffness, mass distribution, and boundary conditions. Modal analysis extracts these frequencies and their associated mode shapes from measured vibration data.
The process works as follows. Operational Modal Analysis (OMA) records building response under ambient excitation—wind, foot traffic, equipment vibration—using the accelerometer array. From the recorded time series, signal processing algorithms extract the first 3–5 natural frequencies and mode shapes. If a connection loosens, a crack forms, or stiffness degrades, the natural frequency drops and the mode shape changes.
The baseline finite element (FE) model is the reference point. The initial FE model computes theoretical frequencies based on design drawings. Measured frequencies are compared to theoretical values; boundary conditions and stiffness parameters are adjusted until the model matches reality. This calibrated baseline becomes the benchmark. Quarterly or annual re-measurements compare current modal properties against the baseline.
A frequency drop greater than 5% from baseline indicates a warning condition. A drop greater than 15% requires immediate engineering assessment. Per FEMA P58, modal parameter changes are used as an early-stage damage indicator before visual or NDT inspection.
Table 2 lists typical first-mode frequency ranges for steel buildings by height. For fatigue design principles that SHM complements, see steel structure fatigue design. For in-service fatigue assessment methodology, read steel structure fatigue assessment.
Table 2: Typical Modal Frequency Ranges for Steel Buildings
| Building Type | Height (m / ft) | 1st Mode (Hz) | 2nd Mode (Hz) | Notes |
|---|---|---|---|---|
| Low-rise warehouse | 6–10 / 20–33 | 4.0–8.0 | 8.0–14.0 | Stiff frame, short period |
| Single-story factory | 8–15 / 26–49 | 2.5–5.0 | 5.0–10.0 | Crane girder flexibility |
| Mid-rise office | 20–40 / 66–131 | 1.0–2.5 | 2.5–5.0 | Sway mode dominates |
| High-rise frame | 60–120 / 197–394 | 0.2–1.0 | 0.8–2.5 | Wind-induced vibration |
These are approximate ranges; actual frequencies depend on bay spacing, bracing, and floor mass. Always compare measured values against your own baseline model, not generic ranges.
Want to Know Before a Crack Becomes a Collapse?
We design SHM packages that put strain gauges on critical connections and accelerometers on every floor—then compare real-world vibration against your finite element baseline. Damage shows up as a 5% frequency shift, not a visible crack.
Damage Detection and Fatigue Monitoring
Steel building structural health monitoring detects damage through two complementary approaches: direct measurement and indirect inference.
Direct methods compare measured stress against design allowables. If a strain gauge reads above 80% of design stress, the system raises a warning. Above 100%, it triggers an alarm. Crack gauges (compliant foil strips bonded across a suspected crack path) detect crack initiation and growth at crane girder welds and recurring-load connection nodes. Corrosion sensors measure electrical resistivity and chloride content in coastal or industrial atmospheres.
Indirect methods use modal parameter changes to locate damage. When a mode shape changes or a frequency drops, algorithms like modal strain energy decomposition identify which structural element has lost stiffness. This is the key advantage of SHM: it finds damage that no one can see, in a connection no one regularly inspects.
SHM does not replace visual inspection. It complements it. A 24/7 monitoring system flags anomalies, and human inspectors are dispatched to the flagged location. This concentrates inspection budget where it is needed, not on a building-wide walk every quarter.
Table 3 lists the primary damage indicators and their threshold actions. For corrosion inspection methods, see steel structure corrosion inspection. For remaining service life estimation, read steel building remaining service life.
Table 3: SHM Damage Indicators and Thresholds
| Indicator | Normal Range | Warning Threshold | Alarm Threshold | Action Required |
|---|---|---|---|---|
| Stress ratio (measured/design) | < 0.6 | 0.6–0.8 | > 0.8–1.0 | Warning: monitor. Alarm: inspect. |
| Modal frequency change | < ±2% | ±5% | ±15% | Warning: re-survey. Alarm: engineering review. |
| Mid-span deflection | < L/360 | L/360–L/240 | > L/240 | Warning: check loading. Alarm: offload. |
| Crack gauge elongation | < 0.01 mm (0.0004 in) | 0.01–0.1 mm (0.0004–0.004 in) | > 0.1 mm (0.004 in) | Warning: track growth. Alarm: repair. |
| Corrosion rate (resistivity) | < 20 kΩ·cm | 20–50 kΩ·cm | > 50 kΩ·cm loss | Warning: coating check. Alarm: NDT scan. |
L = beam span. Thresholds should be calibrated against the structure's design documents and updated after any structural modification.
Alarm Thresholds and Data Management
A three-tier alarm structure keeps response proportional to risk:
- Yellow (advisory): measured stress reaches 60–80% of design, or modal frequency drifts 2–5%. Increase sampling rate and schedule a targeted inspection.
- Orange (alert): stress exceeds 80% of design, or frequency drops by more than 5%. Dispatch an engineer for hands-on inspection within 48 hours.
- Red (emergency): stress exceeds 100% of design, or frequency drops by more than 15%. Offload the affected area, evacuate if necessary, and engage a structural engineer immediately.
Data management follows retention and integration rules. Raw sampling data is retained for 3–5 years to support trend analysis. A well-designed steel building structural health monitoring system also logs alarm events and their resolution timestamps, creating an audit trail for insurance and regulatory review. Wired Ethernet is preferred for permanent installations where stable power and bandwidth exist; wireless LoRaWAN or 5G is used for retrofit projects where running conduit is impractical. Sensor locations are mapped onto the BIM or digital twin model, so engineers see the alarm in 3D context rather than as a number on a spreadsheet.
For digital twin integration, see steel building digital twin. For how BIM fabrication models carry sensor placement data, read steel building BIM digital fabrication.
SHM Cost and ROI
The investment in steel building structural health monitoring scales with channel count and integration depth:
- Basic strain monitoring package (20 points): $8,000–$20,000 including sensors, data acquisition, and installation.
- Accelerometer modal package (16 channels): $15,000–$35,000 including OMA software license.
- Annual cloud platform and data service: $1,000–$5,000 per year.
- Fully integrated SHM + digital twin system: $50,000–$150,000 or more, depending on building size.
The return on investment is risk-based. A single unplanned structural failure in an industrial facility can cost $500,000–$5,000,000+ in downtime, product loss, liability, and repair. SHM that prevents one such event in a 10-year service life pays back its entire 5–10 year investment. For corrosion maintenance planning, see steel structure corrosion maintenance schedule. For total cost of ownership over the building life, read maintenance TCO.
Conclusion
Steel building structural health monitoring combines strain gauges, accelerometers, modal analysis, and damage detection to measure the steel itself—not the environment. It is not necessary for every steel building: a standard warehouse with no crane, no long span, and low occupancy does not justify the capital. SHM earns its cost on crane girders under repeated loading, long-span roofs, seismically vulnerable retrofits, and historic structures where a hidden crack could become an outage or a collapse. Set three-tier alarm thresholds against design stress and baseline modal frequency, and use SHM to direct human inspection where the data says it matters.
A Temperature Sensor Is Not Structural Monitoring.
We install strain gauges on critical connections, accelerometers on every floor, and modal analysis that compares real vibration against your FE baseline. Damage shows up as a 5% frequency shift—long before it shows up as a crack.
🏭 Explore: Steel Factory · Steel Workshop
About the Author
Senior Structural Engineer
With over 20 years of hands-on experience in steel structure design and prefabricated building engineering, our in-house senior structural engineer has personally contributed to more than 500 steel building projects—including warehouses, industrial factories, aircraft hangars, agricultural buildings, and commercial structures. The focus is on translating design codes such as AISC 360, ASCE 7, and Eurocode 3 into buildable, cost-effective steel solutions that balance structural performance, fabrication efficiency, and total project cost.
Learn more about our engineering team
Case Example
A 3,200 m² (34,400 sq ft) heavy fabrication plant in western Pennsylvania installed a permanent SHM system after a 10-ton overhead crane girder developed a visible web crack at the end connection during annual NDT. The challenge was distinguishing fatigue crack growth from normal thermal expansion at 18 monitored connection nodes. The solution deployed 32 resistance foil strain gauges at crane girder weld toes and column bases, paired with 8 piezoelectric accelerometers for operational modal analysis at 200 Hz. A baseline finite element model was calibrated against ambient vibration measurements within the first month. Over 18 months, the system detected a 7% modal frequency drift at one girder—a yellow alert that triggered targeted NDT and revealed a growing crack at a stiffener-to-web weld. The crane was offloaded and repaired within 48 hours, avoiding a potential catastrophic failure. For crane runway inspection protocols, see steel overhead crane runway maintenance.
Frequently Asked Questions
Q1: What is the difference between IoT monitoring and structural health monitoring?
IoT monitoring tracks environmental and operational data—temperature, humidity, energy use, equipment runtime. Structural health monitoring (SHM) measures the steel itself: strain, acceleration, displacement, and crack propagation. IoT answers "is the building comfortable?" SHM answers "is the steel safe?" SHM uses strain gauges and accelerometers at 50–500 Hz sampling; IoT sensors sample at 1–10 minute intervals.
Q2: How many sensors does a steel building need for SHM?
A typical low-rise steel building needs 20–40 strain gauges on critical connections (column bases, beam ends, crane girder flanges) and 8–16 accelerometers distributed across floors for modal analysis. Large-span or high-rise structures may need 100+ channels. A 20-channel strain package runs $8,000–$20,000; a 16-channel acceleration modal system adds $15,000–$35,000.
Q3: How does modal analysis detect damage in a steel frame?
Each structure has natural vibration frequencies determined by its stiffness and mass. When a connection loosens, a crack forms, or stiffness degrades, the natural frequency drops and the mode shape changes. SHM compares current modal properties against a baseline finite element model. A 5% frequency drop triggers a warning inspection; a 15% drop requires immediate engineering assessment.
Q4: Is SHM worth it for a small warehouse?
Usually no. A standard warehouse with no crane, no long span, and low occupancy does not justify SHM capital. SHM is cost-effective for crane girders under repeated loading, long-span roofs (over 30 m / 100 ft), seismically vulnerable retrofits, and historic or landmark structures where failure risk justifies the $15,000–$50,000 investment.
Q5: What sampling rate should SHM sensors use?
Static monitoring (creep, settlement, long-term strain trends) samples at 1–10 Hz. Dynamic monitoring (fatigue, wind-induced vibration, seismic response) requires 50–500 Hz to capture the first few natural modes. Over-sampling wastes storage and power; under-sampling aliases high-frequency fatigue signals. The data acquisition system should be programmable so the sampling rate can increase when an alarm condition triggers.
Reference Links
- ISO 16589 Structural Health Monitoring Framework — International standard providing the framework for structural health monitoring system design, sensor placement documentation, and performance criteria.
- FEMA P58 Seismic Performance Assessment — FEMA methodology for seismic performance assessment and damage classification that SHM modal thresholds are benchmarked against.
steel-roof-ice-dam-snow-load-mitigation
steel-cold-formed-steel-framing-design